Weekly Market Commentary
February 23rd, 2026
Week in Review
Last week’s data provided investors with a clearer sense of an economy that is still progressing but slowing at the margins, with steady activity in some areas and renewed caution in others.
Regional manufacturing surveys helped to set the tone. The Empire State Manufacturing Survey showed modest expansion with a headline reading of 7.1, above the expected reading of 6.4. This was supported by improving labor conditions and rising backlogs, even as shipments softened. The Philadelphia Federal Reserve Manufacturing Index also came in strong at 16.3 versus the 7.5 expected. This substantial outperformance indicates a strong manufacturing sector in the Philadelphia Federal Reserve district and could translate to a more resilient U.S. dollar in the coming weeks. Together, these reports indicate that early-quarter manufacturing remains stable.
Consumer sentiment provided additional context. The University of Michigan’s Consumer Sentiment Index rose to 57.3 in February, representing a modest increase from 56.4 in January of 2026. However, this is still nearly 20% below last year’s level for February. Also, year-ahead inflation expectations fell to 3.5%, while long-term expectations were up slightly to 3.4%. This suggests that households are adjusting gradually to the current price environment, even if confidence is still subdued.
Another important release was the Personal Consumption Expenditures (PCE) inflation report, which increased by 0.4% month over month. This PCE reading was hotter than expected and signaled to investors that progress on inflation remains slow. This reinforced the idea that policymakers will proceed carefully before considering adjustments to current interest rate settings.
In addition, housing starts climbed to an annualized rate of 1.48 million, and building permits rose to 1.52 million. This indicated strengthening construction activity and improving builder confidence. However, pending home sales fell by 0.8% month over month, which reflected the persistent strain caused by limited resale supply and elevated prices.
Friday brought the release of the Q4 gross domestic product (GDP) estimate, which came in at 1.4%, far below the 2.8% growth that was expected. It is important to note that this weaker reading was influenced meaningfully by the extended federal government shutdown, which lasted from early October through mid-November. When taken alongside the firm PCE reading, this soft growth figure suggests that the path toward a balanced economic environment remains uneven and that incoming data will continue to guide market expectations.
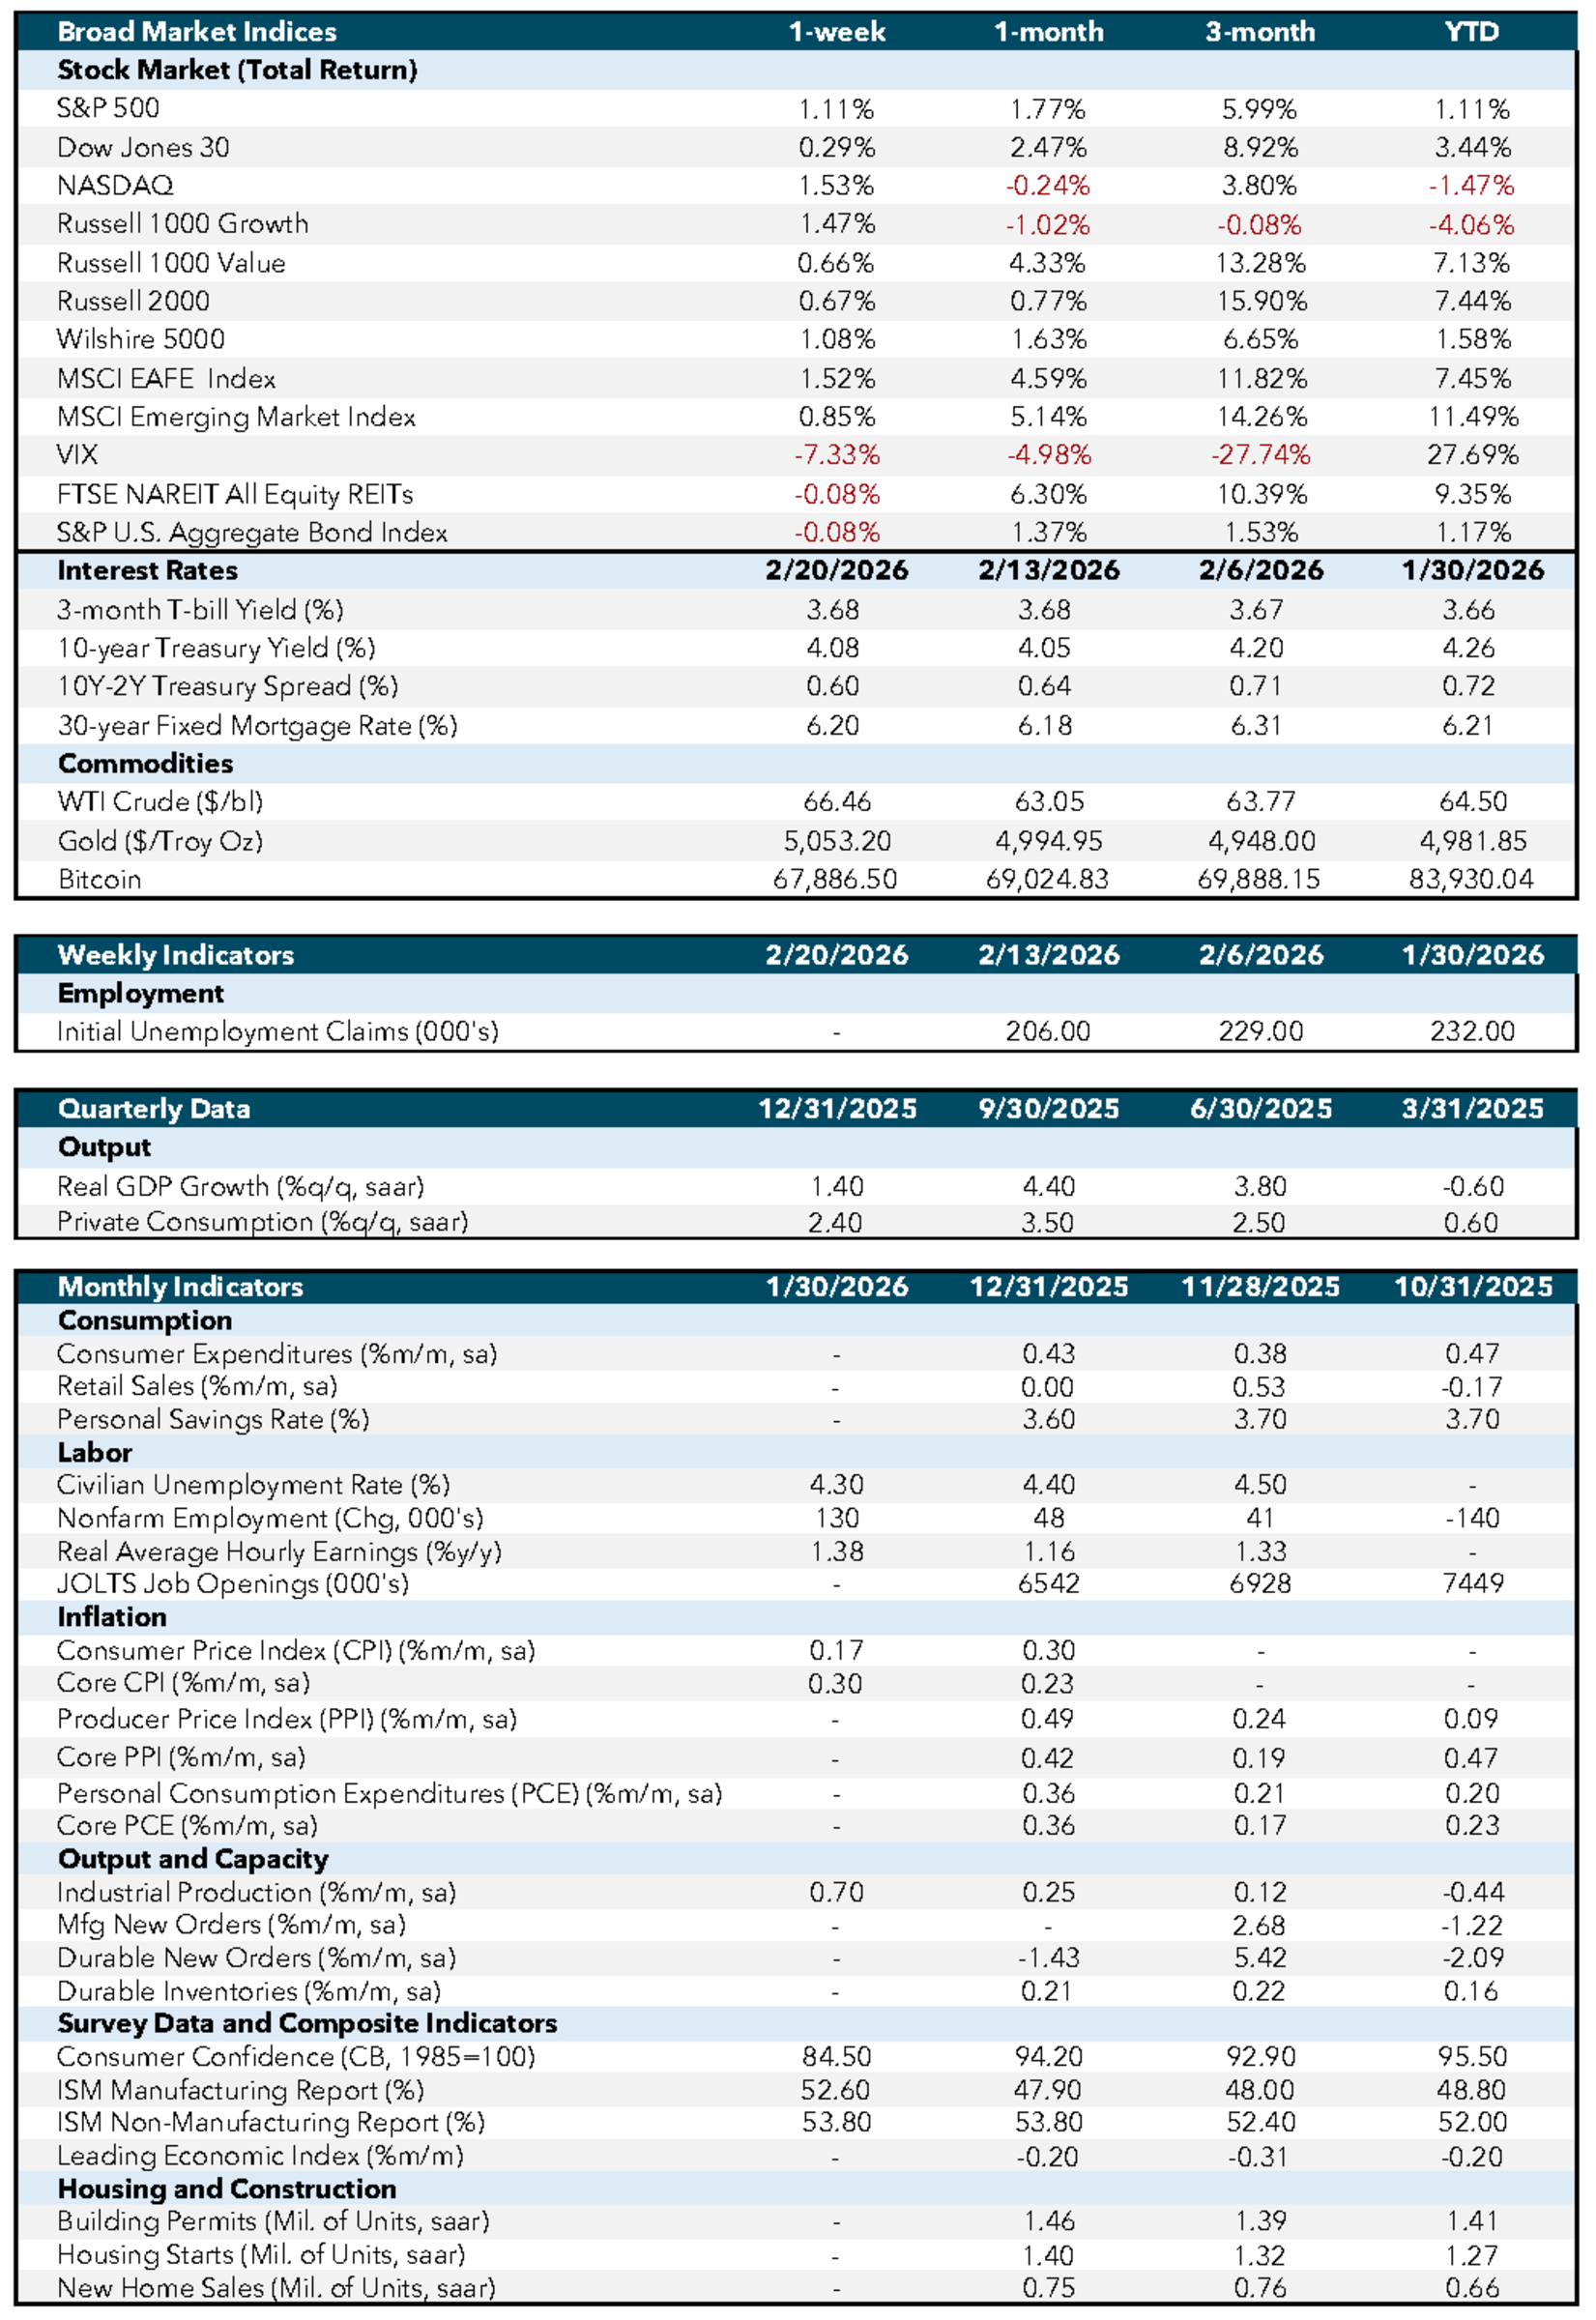
Economic and Capital Markets Dashboard
Week Ahead…

The final week of February will give investors a concentrated set of indicators that speak directly to the state of United States consumer conditions, manufacturing sentiment, housing dynamics, and underlying inflation pressures.
Tuesday will begin with the release of the S&P and Case-Shiller home price indices for December alongside the Federal Housing Finance Agency house price measure. These updates will provide an important read on home price momentum at a time when affordability remains a central concern for households. In addition, the Conference Board Consumer Confidence Index will round out the day and is likely to receive heightened attention, given the recent sensitivity of sentiment data to labor market and inflation developments.
Wednesday will feature the weekly crude oil inventories report from the Energy Information Administration, one of the most closely watched energy releases of the month. Recent data showed a sizable nine-million-barrel draw in mid-February, a figure that sharply exceeded expectations and signaled stronger-than-anticipated demand or tighter supply conditions. This week’s reading will help investors gauge whether that sharp draw was an anomaly or the beginning of a more persistent trend, which could influence both inflation expectations and broader risk sentiment, given the sensitivity of markets to energy prices.
The week will conclude with January producer price data and the February Chicago Purchasing Managers’ Index (PMI). Producer prices will be watched closely as a signal of upstream inflation. The Chicago PMI will bring a timely regional perspective on manufacturing activity and will be evaluated for confirmation of trends seen in other February surveys. Construction spending data will also be released at the end of the week. This will provide insight into the current dynamics of both residential and nonresidential building activity.
In summary, the week’s releases carry the potential to clarify whether early-year momentum is continuing or cooling and will help shape expectations for both Federal Reserve policy and market positioning as the month draws to a close.
Economic Indicators:
- CPI: Consumer Price Index measures the average change in prices paid by consumers for goods and services over time. Source: Bureau of Labor Statistics.
- Core CPI: Core Consumer Price Index excludes food and energy prices to provide a clearer picture of long-term inflation trends. Source: Bureau of Labor Statistics.
- PPI: Producer Price Index measures the average change in selling prices received by domestic producers for their output. Source: Bureau of Labor Statistics.
- Core PPI: Core Producer Price Index excludes food and energy prices to provide a clearer picture of long-term inflation trends. Source: Bureau of Labor Statistics.
- PCE: Personal Consumption Expenditures measure the average change in prices paid by consumers for goods and services. Source: Bureau of Economic Analysis.
- Core PCE: Core Personal Consumption Expenditures exclude food and energy prices to provide a clearer picture of long-term inflation trends. Source: Bureau of Economic Analysis.
- Industrial Production: Measures the output of the industrial sector, including manufacturing, mining, and utilities. Source: Federal Reserve.
- Mfg New Orders: Measures the value of new orders placed with manufacturers for durable and non-durable goods. Source: Census Bureau.
- Durable New Orders: Measures the value of new orders placed with manufacturers of durable goods. Source: Census Bureau.
- Durable Inventories: Measures the value of inventories held by manufacturers for durable goods. Source: Census Bureau.
- Consumer Confidence (CB, 1985=100): Measures the degree of optimism that consumers feel about the overall state of the economy and their personal financial situation. Source: Conference Board.
- ISM Manufacturing Report: Measures the economic health of the manufacturing sector based on surveys of purchasing managers. Source: Institute for Supply Management.
- ISM Non-Manufacturing Report: Measures the economic health of the non-manufacturing sector based on surveys of purchasing managers. Source: Institute for Supply Management.
- Leading Economic Index: Measures overall economic activity and predicts future economic trends. Source: Conference Board.
- Building Permits (Mil. of Units, saar): Measures the number of new residential building permits issued. Source: Census Bureau.
- Housing Starts (Mil. of Units, saar): Measures the number of new residential construction projects that have begun. Source: Census Bureau.
- New Home Sales (Mil. of Units, saar): Measures the number of newly constructed homes sold. Source: Census Bureau.
- SA: Seasonally adjusted.
- SAAR: Seasonally adjusted annual rate.
Market Indices & Indicators:
- S&P 500: A market-capitalization-weighted index of 500 leading publicly traded companies in the U.S., widely regarded as one of the best gauges of large U.S. stocks and the stock market overall.
- Dow Jones 30: Also known as the Dow Jones Industrial Average, it tracks the share price performance of 30 large, publicly traded U.S. companies, serving as a barometer of the stock market and economy.
- NASDAQ: The world’s first electronic stock exchange, primarily listing technology giants and operating 29 markets globally.
- Russell 1000 Growth: Measures the performance of large-cap growth segment of the U.S. equity universe, including companies with higher price-to-book ratios and growth metrics.
- Russell 1000 Value: Measures the performance of large-cap value segment of the U.S. equity universe, including companies with lower price-to-book ratios and growth metrics.
- Russell 2000: A market index composed of 2,000 small-cap companies, widely used as a benchmark for small-cap mutual funds.
- Wilshire 5000: A market-capitalization-weighted index capturing the performance of all American stocks actively traded in the U.S., representing the broadest measure of the U.S. stock market.
- MSCI EAFE Index: An equity index capturing large and mid-cap representation across developed markets countries around the world, excluding the U.S. and Canada.
- MSCI Emerging Market Index: Captures large and mid-cap representation across emerging markets countries, covering approximately 85% of the free float-adjusted market capitalization in each country.
- VIX: The CBOE Volatility Index measures the market’s expectations for volatility over the coming 30 days, often referred to as the “fear gauge.”
- FTSE NAREIT All Equity REITs: Measures the performance of all publicly traded equity real estate investment trusts (REITs) listed in the U.S., excluding mortgage REITs.
- S&P U.S. Aggregate Bond Index: Represents the performance of the U.S. investment-grade bond market, including government, corporate, mortgage-backed, and asset-backed securities.
- 3-Month T-bill Yield (%): The yield on U.S. Treasury bills with a maturity of three months, reflecting short-term interest rates.
- 10-Year Treasury Yield (%): The yield on U.S. Treasury bonds with a maturity of ten years, reflecting long-term interest rates.
- 10Y-2Y Treasury Spread (%): The difference between the yields on 10-year and 2-year U.S. Treasury bonds, often used as an indicator of economic expectations.
- WTI Crude ($/bl): The price per barrel of West Texas Intermediate crude oil, a benchmark for U.S. oil prices.
- Gold ($/Troy Oz): The price per troy ounce of gold, a standard measure for gold prices.
- Bitcoin: A decentralized digital currency without a central bank or single administrator, which can be sent from user to user on the peer-to-peer bitcoin network.
This content was developed by Cambridge from sources believed to be reliable. This content is provided for informational purposes only and should not be construed or acted upon as individualized investment advice. It should not be considered a recommendation or solicitation. Information is subject to change. Any forward-looking statements are based on assumptions, may not materialize, and are subject to revision without notice. The information in this material is not intended as tax or legal advice.
Investing involves risk. Depending on the different types of investments there may be varying degrees of risk. Socially responsible investing does not guarantee any amount of success. Clients and prospective clients should be prepared to bear investment loss including loss of original principal. Indices mentioned are unmanaged and cannot be invested into directly. Past performance is not a guarantee of future results.
The Dow Jones Industrial Average (DJIA) is a price-weighted index composed of 30 widely traded blue-chip U.S. common stocks. The S&P 500 is a market-cap weighted index composed of the common stocks of 500 leading companies in leading industries of the U.S. economy. The NASDAQ Composite Index is a market-value weighted index of all common stocks listed on the NASDAQ stock exchange.
Securities offered through Cambridge Investment Research, Inc., a broker-dealer, member FINRA/SIPC, and investment advisory services offered through Cambridge Investment Research Advisors, Inc., a Registered Investment Adviser. Both are wholly-owned subsidiaries of Cambridge Investment Group, Inc. V.CIR.0226-0670